Research on the Application of Colorimeters in Color Quality Control of Liquid Foods
I. Introduction
In the international food trade and consumer market, as the old saying goes, "color, aroma, and taste are all essential," among which "color" ranks first. The color of liquid foods (including clarified liquids, emulsion liquids, and viscous semi-solid sauces) is not only the external manifestation of their intrinsic quality and freshness, but also the primary sensory element affecting consumers' purchasing decisions. For example, the bright orange color of orange juice represents an abundance of vitamins, the pure white color of milk reflects the emulsification stability of fat and protein, and the reddish-brown color of soy sauce directly embodies the maturity of the fermentation process.
However, during the production and storage processes, liquid foods are highly prone to color drift due to thermal processing, oxidation reactions, enzymatic browning, light exposure, and microbial activities. If there is a visible color difference between different batches of products, consumers will often suspect product spoilage or formula instability, thereby causing irreversible damage to brand trust. Traditional methods that rely on human eyes for color comparison suffer from huge subjective errors. Against this backdrop, the application of high-precision, digital colorimeters (spectrophotometers) for quantified quality control has become an important trend for the modern liquid food industry to achieve standardized, globalized, and cross-regional production.
II. Core Technical Difficulties and Color Measurement Modes in Liquid Food Color Measurement
Unlike solid or powdered foods, liquid foods face diversified challenges in color measurement due to their unique physical and optical characteristics, which are mainly manifested in the following aspects:
1.Transmission Measurement of Transparent Liquids: Such as liquor, clarified fruit juice, edible oil, mineral water, etc. These samples possess light permeability, and their color depends mainly on the absorption characteristics of transmitted light. Measuring this type of liquid must adopt the Transmission Mode. Through a sample cell (cuvette) with a fixed optical path, the light penetrating the liquid enters the optical detector. This type of liquid usually focuses not only on the conventional L* a* b* color space, but also relies heavily on specific industry color indexes, such as the Platinum-Cobalt index (APHA/Pt-Co) and Gardner index used for edible oils and resins, as well as the Saybolt color scale used for certain petroleum products.
2.Dual-Mode Measurement of Turbid and Emulsion Liquids: Such as milk, yogurt, turbid fruit juice, thick soup, etc. These liquids contain a large amount of protein microparticles, fat globules, or fruit pulp fibers inside, and strong scattering and absorption will occur after light enters. If only the transmission method is used, the light cannot penetrate; if only the reflection method is used, the optical features of the internal medium cannot be captured. Therefore, these foods often require colorimeters that accommodate the Dual Mode of transmission + reflection to comprehensively evaluate their surface color and overall turbidity.
3.Non-Contact and Professional Container Measurement of High-Viscosity Semi-Solid Liquids: Such as flavoring sauces (tomato sauce, salad dressing), honey, oyster sauce, etc. These samples do not flow easily and can very easily adhere to the measurement window, causing contamination of the optical lens, which makes cleaning extremely inconvenient and may even trigger cross-contamination of food. The key to solving this difficulty lies in using colorimeters equipped with specialized testing accessories (such as liquid sample cups of specific specifications), or adopting a non-contact measurement architecture, ensuring both hygienic safety and data accuracy.
III. Adaptation Solutions of CHNSpec Colorimeters in Liquid Food Color Management
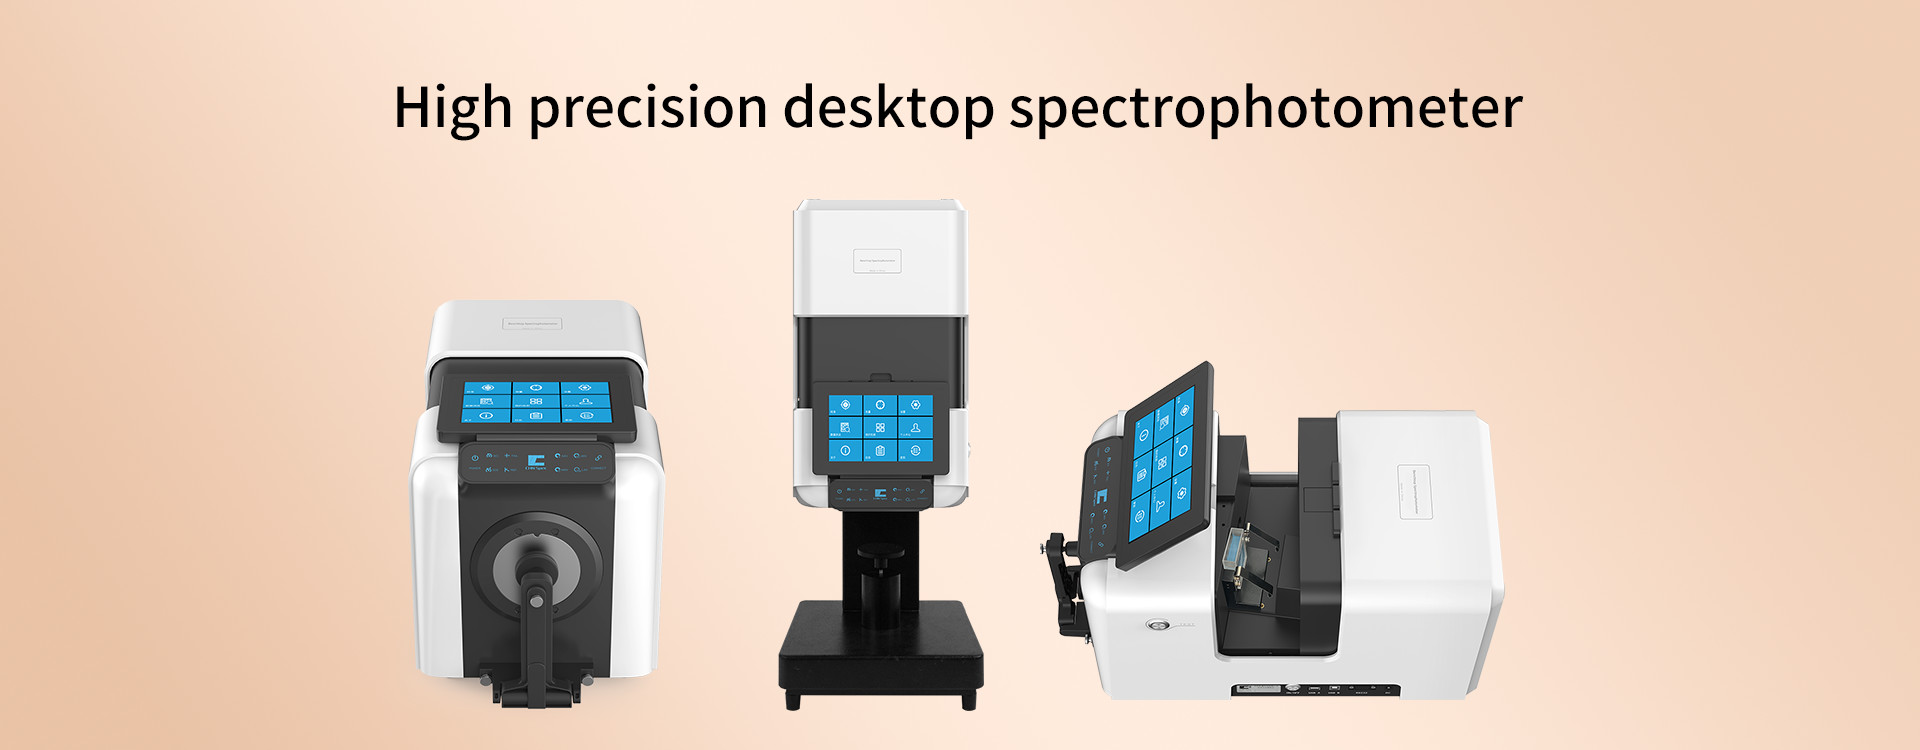
1.DS-812N Series / CS-810 Benchtop Liquid Spectrophotometric Colorimeter
Aiming at high-transparency liquid foods such as mineral water, liquor, edible oil, and clarified syrup, CHNSpec has launched the DS-810N and CS-810 benchtop liquid-specific colorimeters.
Optical Performance: The instruments adopt the D/0 illumination geometry condition, with built-in high-sensitivity, UV-enhanced silicon photodiodes as receivers, significantly upgrading the measurement range of transmittance to 0~200%. This ensures that even when facing liquid samples whose colors are extremely close to transparent with only subtle differences, extremely weak optical fluctuations can still be captured.
Integrated Specialized Color Indexes: They can not only directly output precise L* a* b*and ΔE* data, but also perfectly integrate multiple parameters universal in international food and chemical trade, such as the Platinum-Cobalt index (APHA/Pt-Co), Gardner index, yellowness, absorbance, and concentration. By eliminating the subjective randomness of manual visual eye color comparison, they provide fully traceable digital evidence for international trade.
2.CS-821N Series Advanced Benchtop Spectrophotometer Colorimeter
For complex turbid, emulsion, or dark liquid foods such as milk, soy milk, thick fruit juice, rice wine, and soy sauce, the CHNSpec CS-821N benchtop spectrophotometer is the ideal choice for the industry.
Dual-Optical Path Spectrum Analysis Technology: The CS-821N adopts a high-intensity pulsed xenon lamp as the light source, cooperating with dual-optical path spectrum analysis technology, which can monitor micro-fluctuations of the light source in real time and perform automatic compensation, guaranteeing extremely high measurement repeatability (the standard deviation of spectral reflectance is within 0.08%).
Full Compatibility of Reflection + Transmission: The instrument supports the D/8 (diffused illumination geometry, 8-degree viewing) reflection mode and D/0 transmission mode, easily mastering color determination from solids and powders to various complex liquids. When measuring milk, its optical architecture can accurately distinguish the faint whiteness and yellowness differences caused by different fat contents (whole fat, low fat, skimmed) or the addition of high-calcium components; when facing soy sauce or petrochemical liquids, it can also provide color data with an extremely high signal-to-noise ratio.
IV. Quality Control Process Application of Colorimeters in Liquid Food Production
In actual international and local liquid food supply chains, the digital color management of CHNSpec colorimeters runs through three core links:
1.Fine Screening of Raw Materials Entering the Factory: Raw materials entering the factory, such as fruit juice puree, fresh milk, and crude vegetable oil, have base colors that are heavily influenced by origin and season. Using a colorimeter to determine their initial color data can provide a foundation for subsequent formula fine-tuning, preventing color fluctuations of raw materials from causing inconsistency in the final finished product.
2.Optimization of Processing Technology Parameters: In liquid food processes such as ultra-high temperature sterilization (UHT), evaporative concentration, and fermentation (such as soy sauce and beer brewing), excessive heating will lead to the Maillard reaction (browning), thereby deepening the product color. By periodically drawing online samples and measuring them with CHNSpec colorimeters, the heating temperature, pressure, and time can be dynamically adjusted to ensure that the process is maintained in the optimal golden zone.
3.Finished Product Out-of-Factory and Shelf-Life Consistency Assurance: When products are sold to different supermarkets and shelves around the world, a visually uniform color can tremendously establish a high-end, rigorous brand image. Colorimeters can also be used for simulated shelf-life testing, monitoring the impact of light and temperature on the color of food inside liquid packaging, and providing objective quantified data for the improvement of light-shielding and oxygen-barrier properties of packaging materials.
V. Conclusion
Today, with increasingly strict international food trade access and consumers' more and more demanding requirements for quality, traditional eye color evaluation can no longer meet the needs of the high-end food manufacturing industry in foreign trade. The colorimeter converts abstract, person-dependent visual sensory experiences into universal digital assets of international standards.
The multiple models of precision spectrophotometric colorimeters provided by CHNSpec, including the DS-812N series, CS-810, and CS-821N series, by virtue of their dual-optical path analysis technology, ultra-wide transmission range, and deeply integrated multi-industry specialized color indexes, have constructed a scientific, rigorous, and traceable modern color quality control system for liquid food enterprises. Introducing high-precision colorimeters can not only effectively control the defective rate and save raw materials, but also significantly enhance the core competitiveness of brands in the international market, making every bottle opening a perfect feast of vision and taste.


 english
 français
 Deutsch
 Italiano
 Русский
 Español
 português
 Nederlandse
 ελληνικά
 日本語
日本語
 한국
한국
 العربية
 Türkçe
 tiếng Việt
 ไทย
ไทย